Wifi Probe Visualisation
A co-worker of mine had a security-related talk recently and wanted something cool to show. We talked about some "live-hacking" approaches. But most of them were not really accessible for non-tech related people. So we needed something, that is simple to pull off (by us) and to understand by the audience.
If you are into Wifi Hacking you may know that devices are broadcasting the names of known networks into the wild. Which, kind of makes sense, right? If you set your home network in your smartphone, it (your smartphone) will always connect to that known network if it's in reach. Which is nice user experience, but have you ever wondered how this is possible?
Beacons & Probes
Like mentioned earlier, all Wifi devices are broadcasting some kind of requests (beacons/probes) into the wild. If this device is an Access Point it sends beacons. Basically saying, hi there! it's me! network xyz. I am an AP! Come & connect with me!.
If we now look at our smartphone with our saved home network, it could, for example, listen for this beacons. But it would have to listen all the time, on all channels for these beacons. Which is time & energy-consuming.
That's why we have probe requests. What they do, is basically saying, Hi! I'm here! What cool networks are also here, I could connect to?.
And it sends these requests at various intervals and waiting for a response. If we are at home, our wifi access point would pick that probe up and answer it. Our smartphone then would know, that our home network is near and connect to it.
This sounds cool. Right? But we got some issues here. First, these probe requests containing the MAC address of the device. Broadcasting a unique identifier is never a good idea. Furthermore, the probe requests may also contain a list of access points, the device connected in the past (SSIDs).
This means, every time you walk around and have your wifi on (or off) and are not connected to a network, you will broadcast your MAC address and often a list of your last connected networks into the public.
Abusing
Well, I guess you already know why this is an issue. There are several attack vectors for this. For once if you know what networks the device was connected to, it is easy to launch a evil twin attack. Besides this, it is possible to track users with this. If you have a network of access points (there are enough public wifi spots out there) you can track the movement of people. Because the MAC address is unique.
It can get even more sophisticated if you analyze the networks people were connected to.
Let's get dirty
Okay, enough theory. This sounds like a cool possibility for a talk. The idea is to launch a script, capture the probes and visualize them.
Because of time pressure (like always), the code is not as robust as it could be, so no hate, please!
Capture the Probe
We can use Wireshark or tcpdump to capture the packets, but I will be using bettercap. Which is an awesome tool!
bettercap is the Swiss Army knife for WiFi, Bluetooth Low Energy, wireless HID hijacking and Ethernet networks reconnaissance and MITM attacks.
The cool thing is, that bettercap already captures management beacons and client probes, while in wifi.recon mode. We actually just need to save the output stream to a file. With set events.stream.output ./client-probes.log.
However, bettercap captures a lot more information then we need. So we need to disable a lot of the events logging.
events.ignore sys.log
events.ignore session.started
events.ignore session.closing
events.ignore update.available
events.ignore endpoint.new
events.ignore endpoint.lost
events.ignore wifi.ap.new
events.ignore wifi.ap.lost
events.ignore wifi.client.handshake
events.ignore wifi.client.new
events.ignore wifi.client.lost
events.ignore mod.started
events.ignore mod.stopped
events.ignore net.sniff.*
With everything unimportant disabled, you will get only the client probes in your log. To streamline this whole process, we can utilize bettercaps caplet system. With them, we can script our session. Which is really cool! You can check out the caplet on github.
Now we always just need to run sudo bettercap -iface en0 -no-colors -caplet client-probe-analyzer.cap
Our logs then will look like this:
[12:20:00] [wifi.client.probe] station xx:xx:xx:xx:xx:xx (OnePlus Tech (Shenzhen) Ltd) is probing for SSID Free Candy (-41 dBm)Perpendicular transparent lines with kittens
Text logs are kind of boring. And not well suited for a talk/demonstration. We need some fancy visualisations! But before that, we need to parse our log file and transform it into a structured format.
The parsing is also like the most fragile part of this whole project. After hours learning and tinkering with awk I did it with javascript & regular expressions.
Although I might rewrite this in python in the future. The reason for javascript was purely based on productivity, as I am most familiar with javascript and after failing with awk + sed I needed something fast that just works. But for learning python, this is a nice exercise. And if I have more time, I will think about better possibilities for parsing it.
The problems I had with the parsing were based on the format of the log. Especially the device name and network name were kinda hard to get, because of variations in their format.
And after running this script for some time and capturing lots of probes, there are sometimes network names that completely break the log file. I am not sure if they break because of some special characters in their name or why.
However, the node script just works fine for most cases. Our output will look like this:
➜ node parse.js
Client: xx:xx:xx:xx:xx:xx - SSID:  Free Wifi
Client: xx:xx:xx:xx:xx:xx - SSID:  UPC1234
Client: xx:xx:xx:xx:xx:xx - SSID:  Legit Wifi Name
After that, we need to import the structured file and build some charts around it. I am using amCharts for this. Because I am quite used to it and it got some nice charts.
I've added two possible groupings:
- Group by client
- Group by network
Group by client
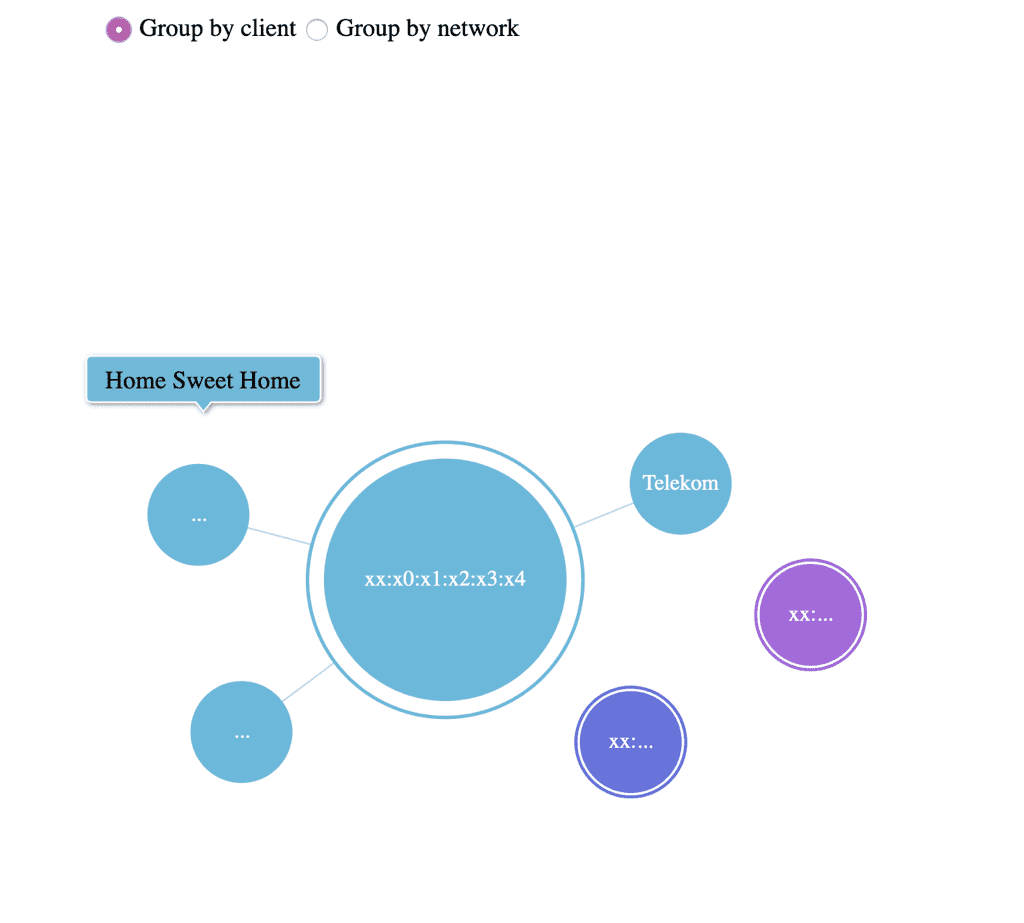
This way each node is a client. The chart is interactive, so you can click on it to reveal the networks he was connected to in the past. This view is kind of cool for demonstrations. Because you can pick a client (which will be in the same room) and reveal the networks he was connected to. It is quite spooky for most people if you know their home wifi network and other networks. This way you can also trace someone if you map out the network locations.
Group by network
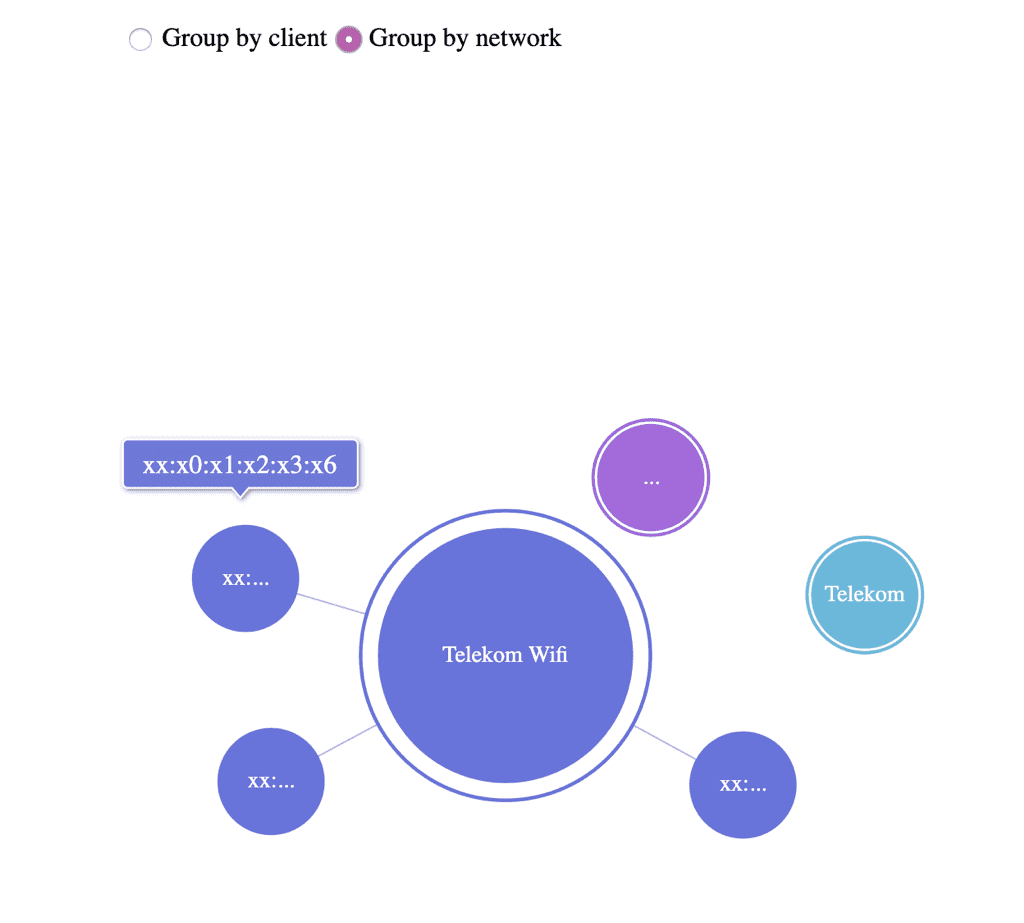
This is the other way around. Each node is a network and you can see the clients as subnodes. This is quite nice for evil twin attacks, as you can see which networks are most popular.
Github
Like always you can find the code on Github